
Building Canvas Apps is easier than ever—but keeping them fast, responsive, and scalable is where the real craft begins.
As apps grow in complexity, connect to multiple data sources, and serve more users, performance can quickly become a challenge. Slow screens, long loading times, delegation warnings, and unpredictable behaviour are often symptoms of decisions made early in development.
The good news? Most performance issues in Canvas Apps are avoidable with the right design patterns and a clear understanding of how Power Apps evaluates formulas, retrieves data, and loads controls on each screen.
Whether you’re optimising an existing solution or laying the groundwork for a new one, adopting performance-focused practices ensures a smoother experience for your users and a more maintainable app for your team.
This is the first part of a series of articles on this topic. Stay tuned for more!
Monitoring
Let’s begin exploring the options available to understand where the performance issues may be.
Monitor Tool
The Monitor tool is one of the most powerful yet underused features available to Canvas App developers. Think of it as an X-ray for your app—it reveals what’s happening behind the scenes every time a user opens a screen, clicks a button, or triggers a formula.
While apps might look simple on the surface, Canvas Apps generate a huge amount of background activity: network calls, data queries, control evaluations, component updates, and more. Monitor captures all of this in real time.
Monitor is a live diagnostic tool that tracks and visualises how your Canvas App behaves during runtime.
It logs every significant event, including:
- Data source calls
- Formulas being evaluated
- Responses from connectors
- Loading events for controls and screens
- Errors, warnings, and delegation messages
You can run Monitor from within Power Apps Studio or attach it to a published app used by another person. This makes it extremely valuable not just for development, but also for troubleshooting issues reported by end users.

Application Insights
While the Monitor tool is perfect for real‑time diagnostics during development and troubleshooting, it isn’t designed for long‑term, continuous performance tracking. That’s where Application Insights comes in.
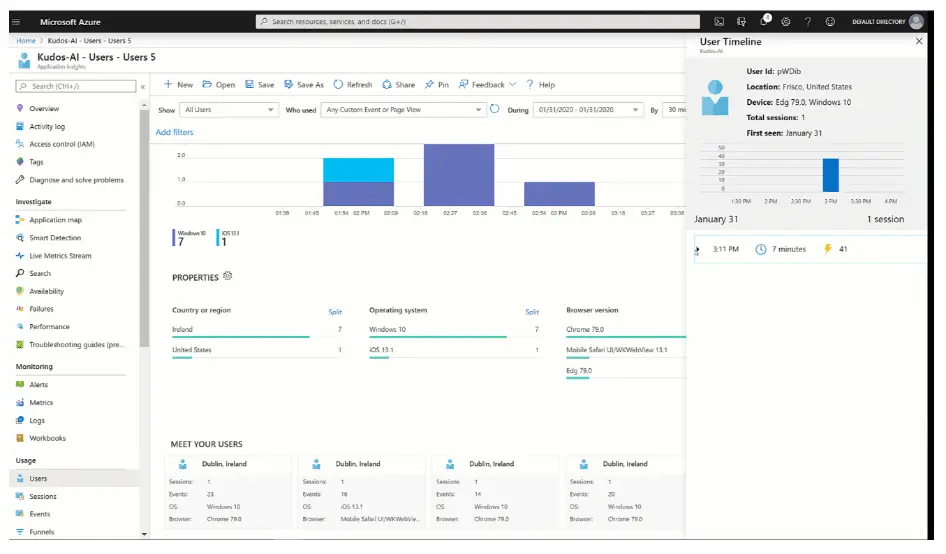
Application Insights (App Insights), part of Azure Monitor, provides a centralised, scalable, and analytics‑driven approach to understanding how your Canvas Apps behave over time—across all users, all devices, and all sessions.
Application Insights is a cloud-based telemetry and monitoring service that collects detailed metrics, traces, errors, and usage analytics from your applications. When integrated with Canvas Apps, it allows you to track:
- Performance bottlenecks
- User behaviour patterns
- Slow or failing data calls
- Flow executions
- Custom events and timing metrics
- Errors that are happening in production
- Geo and device usage
Unlike the Monitor tool—which is session-based—Application Insights captures data continuously, even when you’re not actively watching the app. This makes it ideal for environments where apps are used at scale, across different regions or departments.
App Insights and Monitor are most effective when used together, because they serve different but complementary purposes.
Custom Tracing
While Monitor and Application Insights give you powerful diagnostic capabilities outside the app, sometimes you need performance data from inside the app itself. This is especially useful when:
- You want to measure the execution time of a specific formula
- You want to analyse the performance impact of a screen, component, or user action
- You want to send performance telemetry to Application Insights
- You want lightweight instrumentation without opening the Monitor
This is where Power Apps’ Trace() function becomes extremely valuable. It allows you to write custom telemetry entries that can be viewed in Monitor or sent to external telemetry systems like App Insights.
The Trace() function lets you log custom events directly from your Power Fx code. Each trace can contain:
- A message (string)
- A severity level (Information, Warning, Error)
- A property bag with custom fields for richer analytics
For example:

These events appear in:
- Monitor (under “Traces”)
- Application Insights (if you use the experimental integration)
This means you can create precise, developer‑defined telemetry entries that tell you exactly what happened and when.
Power Fx doesn’t have a built-in “timer” function, but you can easily create performance measurements using:
- Now() to capture timestamps
- Variables to store start/end times
- DateDiff() to calculate measured duration
- Trace() to log the result
For example:

In summary, the Trace() function transforms your Canvas App from a black box into a fully instrumented application. By creating custom performance timers directly in Power Fx, you can measure real execution times, troubleshoot slow behaviours, and feed telemetry into enterprise monitoring systems.
This approach is simple to implement, highly flexible, and incredibly valuable for building fast, reliable Canvas Apps.
Data Sources
Canvas Apps support many data sources, but the two most commonly used across organisations are Dataverse and SharePoint. While both can power robust apps, they behave very differently in terms of performance, scalability, delegation, and data relationships. Understanding their strengths and limitations is essential to building fast and reliable applications.
Dataverse
Dataverse is a cloud-based, enterprise-grade data platform designed specifically for Power Apps, with relational capabilities, rich data types, and strong performance characteristics. When performance matters, Dataverse is often the best choice—especially for medium-to-large applications.
Dataverse offers:
- Native delegation for most Power Fx functions
- Optimised queries that run server-side
- Relational capabilities baked into the platform
- Security at the row and field level
- Consistency across environments and ALM pipelines
Because of these features, Dataverse scales far better than SharePoint for enterprise apps.
One of the strongest features of Dataverse is its relational model. Tables can be linked through:
- One‑to‑many relationships
- Many‑to‑one relationships
- Many‑to‑many relationships
Why relationships matter for performance?
- Faster queries: Dataverse can join related tables server-side, reducing the number of separate data calls your app must make.
- Delegable lookups: When relationships are defined, you can filter in related tables in a fully delegable fashion and far more efficiently than manually filtering client-side.
- Cascading behaviours: You can define cascade rules (delete, assign, etc.) that reduce custom logic in your app.
- Improved data integrity: Foreign keys and constraints prevent orphaned or inconsistent data, reducing errors and improving reliability.
SharePoint
SharePoint is extremely popular as a data source because it’s simple, familiar, and widely available. However, it was not designed as a high-performance relational database, and that means developers must be mindful of its limits.
Where SharePoint Works Well?
SharePoint suits:
- Lightweight apps
- Lists under 20–30k items
- Simple, flat data structures
- Document-driven scenarios
Properly optimised, SharePoint can deliver good performance—but only if you design with its limitations in mind.
SharePoint lists can grow large over time, and once they exceed 5,000 items, the platform imposes a “List View Threshold” that affects filtering and sorting. This is where indexed columns become essential.
Why indexing matters?
Because it improves server-side filtering performance, SharePoint returns results faster and with less strain on the server.
Also, if you try to filter data based on a non-indexed column, and the number of items in the list exceeds 5,000 items, the query will simply return nothing.
Query Optimization
One of the most important concepts in Canvas App performance is delegation—the process by which Power Apps converts your formulas into queries that run directly on the data source (Dataverse, SharePoint, SQL, etc.).
Understanding how delegation works allows you to design formulas that scale, avoid incomplete results, and prevent slow network operations.
Delegation is not just a technical detail—it fundamentally determines how well your app performs.
What is delegation?
When you write a formula, Power Apps must decide whether it can send this filter to the server (Dataverse or SharePoint) or whether it must:
- Pull all of the data down to the client
- Perform the filtering in memory
This is the difference between:
✔️ Fast, scalable, server-side queries
❌ Slow, client-side processing with partial results
If the formula is delegable, Power Apps translates it into a query that the data source understands. If it is non-delegable, Power Apps retrieves only the first portion of the dataset (default = 500 rows, max = 2,000 rows) and processes the rest locally—leading to incomplete records, slow loading, and unpredictable behaviour.
How Power Apps Decides Which Columns and Related Tables to Query?
When your app connects to a data source such as Dataverse or SharePoint, it doesn’t load all the fields or all the related tables by default. Instead, Power Apps dynamically determines what data is needed based entirely on the Power Fx formulas used throughout the app.
The internal Power Apps engine analyses your formulas and builds an execution plan for queries. That plan determines:
- Which columns of a table must be retrieved
- Which related tables must be joined or expanded
- Which filters must be delegated
- Which operations must be done server-side vs. client-side
Understanding how Power Apps decides this is critical for performance, especially for large datasets or complex screens.
Power Apps uses a “column pruning” model.
It will only request columns that your app actually references.
Regarding the related tables, lookup fields create relationships.
When you reference a lookup, Power Apps may fetch related table data.
What triggers related table queries?
- Displaying lookup fields (ThisItem.Customer.Name)
- Filtering on lookup fields
- Sorting by lookup fields
- Using polymorphic lookups (e.g., Owner in Dataverse)
If relationships are properly defined in Dataverse:
- Power Apps can use server-side joins
- Queries remain delegable
- You can avoid multiple LookUp() calls inside a gallery
Conclusion
This is the first part of a series of articles on this topic.
In subsequent articles, we will continue to explore how the way Screens are designed and formulas are written also have an impact on the performance of your apps.
If you are struggling to optimise the performance of any of your apps and need help, don’t hesitate to contact us.
Related webs:
Spark Labs by Creativity Spark, our learning path on YouTube.